

Swanville
As the result of a treaty in 1847, the Winnebago Indians located on lands west of the Mississippi River. A road was cut from the Mississippi River to the Winnebago agency which is, at present, Long Prairie. In addition to providing a route for bringing in the Winnebago, this roadway opened the opportunity for immigration and by the 1860's homesteaders began to settle in the area. In 1893, residents incorporated the Village of Swanville, a community of 180 citizens.
Swanville quickly took advantage of its location in the midst of hardwood forests which were interspersed with agricultural land. A railroad which ran from Little Falls to the Dakotas made transport of goods convenient. Hardwood lumber and agricultural products were shipped by rail.
A Swanville newspaper began publication in 1900. Social events have always been an important part of community life, from social dances and the building of a bandstand to the present day Swanville Carnival. The progressive attitude of Swanville is perhaps best demonstrated by the election of a female mayor, Isabelle Flood, in 1922. One of only two female mayors in the history of Morrison County, she held the office for three terms. Today Swanville continues as a progressive community known best for its production of turkeys.
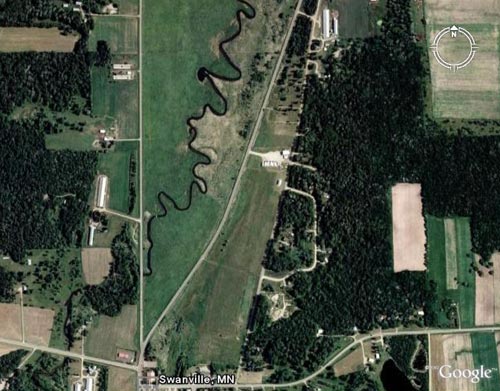
Present day Swanville has a progressive City Council intent on bringing new industry to town. They have developed an industrial park on the north side of town which has two businesses located there already. The City Council has provided assistance to downtown businesses, enabling them to improve their buildings and because of this attitude the downtown area has been reborn.
Swanville Industrial Park
Population
Population
| Population | 2000 | 2010 | 2025 | 2030 |
|---|---|---|---|---|
| Swanville | 354 | 350 | 346 | 352 |
Source: ESRI, 2025-08-25
Population by Age
| Population | 2025 |
|---|---|
| 0-4 | 15 |
| 5-9 | 15 |
| 10-14 | 25 |
| 15-19 | 25 |
| 20-24 | 20 |
| 25-29 | 19 |
| 30-34 | 15 |
| 35-39 | 24 |
| 40-44 | 23 |
| 45-49 | 23 |
| 50-54 | 21 |
| 55-59 | 15 |
| 60-64 | 25 |
| 65-69 | 29 |
| 70-74 | 20 |
| 75-79 | 12 |
| 80-84 | 8 |
| 85+ | 12 |
| 18+ | 275 |
| Median Age | 43 |
Source: ESRI, 2025-08-25
Population by Race
| Swanville | 2025 |
|---|---|
| Total | 346.00 |
| White Alone | 97.11% |
| Black Alone | 0.29% |
| American Indian Alone | 0.29% |
| Asian Alone | 0% |
| Pacific Islander Alone | 0.29% |
| Some Other Race | 1.16% |
| Two or More Races | 0.87% |
| Hispanic Origin | 1.16% |
| Diversity Index | 7.80 |
Source: ESRI, 2025-08-25
Growth Rate
| Swanville | 2025 - 2030 |
|---|---|
| Population | 0.34% |
| Households | 0.51% |
| Families | 2.36% |
| Median Household Income | 3% |
| Per Capita Income | 2% |
Source: ESRI, 2025-08-25
Housing
Households
| Population | 2000 | 2010 | 2025 | 2030 |
|---|---|---|---|---|
| Households | 143 | 141 | 156 | 160 |
| Housing Units | 149 | 157 | 172 | 175 |
| Owner Occupied Units | 131 | 126 | ||
| Renter Occupied Units | 25 | 34 | ||
| Vacant Units | 16 | 15 |
Source: ESRI, 2025-08-25
Home Value
| Swanville | 2025 | 2030 |
|---|---|---|
| Median Home Value | $342,308 | $357,500 |
| Average Home Value | $379,924 | $374,206 |
| <$50,000 | 1 | 0 |
| $50,000 - $99,999 | 4 | 3 |
| $100,000 - $149,999 | 4 | 1 |
| $150,000 - $199,999 | 12 | 11 |
| $200,000 - $249,999 | 17 | 11 |
| $250,000 - $299,999 | 11 | 14 |
| $300,000 - $399,999 | 39 | 40 |
| $400,000 - $499,999 | 25 | 30 |
| $500,000 - $749,999 | 14 | 13 |
| $1,000,000 + | 0 | 1 |
Source: ESRI, 2025-08-25
Housing Year Built
| Year Range | Houses Built |
|---|---|
| 2010 or Later | 6 |
| 2000-2009 | 20 |
| 1990-1999 | 12 |
| 1980-1989 | 18 |
| 1970-1979 | 9 |
| 1960-1969 | 14 |
| 1950-1959 | 8 |
| 1940-1949 | 0 |
| 1939 or Before | 55 |
Source: ESRI, 2025-08-25
Back To TopIncome
Income
| Swanville | 2025 | 2030 |
|---|---|---|
| Median Household | $79,791 | $91,744 |
| Average Household | $89,897 | $98,413 |
| Per Capita | $40,532 | $44,733 |
Source: ESRI, 2025-08-25
Household Income
| Swanville | 2025 |
|---|---|
| <$15,000 | 9 |
| $15,000 - $24,999 | 10 |
| $25,000 - $34,999 | 7 |
| $35,000 - $49,999 | 19 |
| $50,000 - $74,999 | 29 |
| $75,000 - $99,999 | 17 |
| $100,000 - $149,999 | 42 |
| $150,000 - $199,999 | 15 |
| $200,000+ | 8 |
Source: ESRI, 2025-08-25
Back To TopEmployees
Commute
| Category | Commuters |
|---|---|
| Workers 16+ | 119 |
| In-County Residents | 79 |
| Out-of-County Residents | 40 |
| Drive Alone | 106 |
| Carpooled | 5 |
| Public Transport | 0 |
| Work at Home | 2 |
| Motorcycle | 0 |
| Bicycle | 0 |
| Walked | 6 |
| Other | 0 |
| Less than 5 minutes | 8 |
| 5-9 minutes | 12 |
| 10-14 minutes | 4 |
| 15-19 minutes | 3 |
| 20-24 minutes | 34 |
| 25-29 minutes | 17 |
| 30-34 minutes | 23 |
| 35-39 minutes | 0 |
| 40-44 minutes | 0 |
| 45-59 minutes | 6 |
| 60-89 minutes | 8 |
| 90+ minutes | 2 |
| Average Travel Time | 0 |
Source: ESRI, 2025-08-25
Source: ESRI, 2025-08-25
Employees by NAICS
| Category | Number |
|---|---|
| Total Employees | 300 |
| Agr/Forestry/Fish/Hunt | 0 |
| Mining | 0 |
| Utilities | 0 |
| Construction | 0 |
| Manufacturing | 19 |
| Wholesale Trade | 20 |
| Retail Trade | 35 |
| Motor Veh/Parts Dealers | 0 |
| Furn & Home Furnish Str | 0 |
| Electronics & Appl Store | 0 |
| Bldg Matl/Garden Equip | 6 |
| Food & Beverage Stores | 20 |
| Health/Pers Care Stores | 0 |
| Gasoline Stations | 9 |
| Clothing/Accessory Store | 0 |
| Sports/Hobby/Book/Music | 0 |
| General Merchandise Str | 0 |
| Transportation/Warehouse | 37 |
| Information | 0 |
| Finance & Insurance | 10 |
| Cntrl Bank/Crdt Intrmdtn | 6 |
| Sec/Cmdty Cntrct/Oth Inv | 0 |
| Insur/Funds/Trusts/Other | 4 |
| Real Estate/Rent/Leasing | 2 |
| Prof/Scientific/Tech Srv | 5 |
| Legal Services | 0 |
| Mgmt of Comp/Enterprises | 2 |
| Admin/Support/Waste Mgmt | 0 |
| Educational Services | 119 |
| HealthCare/Social Assist | 1 |
| Arts/Entertainment/Rec | 0 |
| Accommodation/Food Srvcs | 8 |
| Accommodation | 0 |
| Food Srv/Drinking Places | 8 |
| Other Srv excl Pub Admin | 13 |
| Auto Repair/Maintenance | 0 |
| Public Administration Emp | 29 |
Source: ESRI, 2025-08-25
Educational Attainment (25+)
| Swanville | 2025 |
|---|---|
| <9th Grade | 8 |
| Some High School | 4 |
| GED | 4 |
| Graduated High School | 90 |
| Some College/No Degree | 57 |
| Associates Degree | 41 |
| Bachelor's Degree | 37 |
| Graduate Degree | 5 |
Source: ESRI, 2025-08-25
Back To TopBusinesses
Businesses by NAICS
| Category | Number |
|---|---|
| Total Businesses | 32 |
| Agr/Forestry/Fish/Hunt Bus | 0 |
| Mining Bus | 0 |
| Utilities Bus | 0 |
| Construction Bus | 0 |
| Manufacturing Bus | 2 |
| Wholesale Trade Bus | 2 |
| Retail Trade Bus | 8 |
| Motor Veh/Parts Dealers Bus | 0 |
| Furn & Home Furnish Str Bus | 0 |
| Electronics & Appl Store Bus | 0 |
| Bldg Matl/Garden Equip Bus | 2 |
| Food & Beverage Stores Bus | 4 |
| Health/Pers Care Stores Bus | 0 |
| Gasoline Stations Bus | 2 |
| Clothing/Accessory Store Bus | 0 |
| Sports/Hobby/Book/Music Bus | 0 |
| General Merchandise Str Bus | 0 |
| Transportation/Warehouse Bus | 2 |
| Information Bus | 0 |
| Finance & Insurance Bus | 3 |
| Cntrl Bank/Crdt Intrmdtn Bus | 1 |
| Sec/Cmdty Cntrct/Oth Inv Bus | 0 |
| Insur/Funds/Trusts/Other Bus | 2 |
| Real Estate/Rent/Leasing Bus | 1 |
| Prof/Scientific/Tech Srv Bus | 1 |
| Legal Services Bus | 0 |
| Mgmt of Comp/Enterprises Bus | 1 |
| Admin/Support/Waste Mgmt Bus | 0 |
| Educational Services Bus | 2 |
| HealthCare/Social Assist Bus | 1 |
| Arts/Entertainment/Rec Bus | 0 |
| Accommodation/Food Srvcs Bus | 1 |
| Accommodation Bus | 0 |
| Food Srv/Drinking Places Bus | 1 |
| Other Srv excl Pub Admin Bus | 6 |
| Auto Repair/Maintenance Bus | 0 |
| Public Administration Bus | 2 |
Source: ESRI, 2025-08-25
Back To Top