

Little Falls
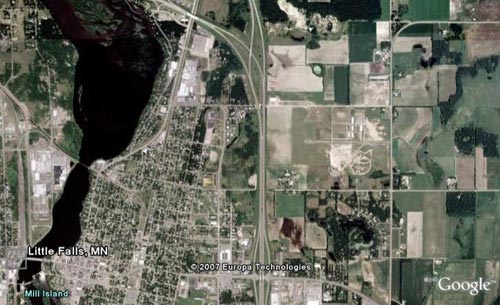
The beautiful falls on the Mississippi River attracted native inhabitants, explorers, traders and settlers. By the 1880's a surge in immigration, railroad expansion and industrial development created a boom. In 1889, Little Falls was incorporated as a city. It is the third oldest city in the state. Due to local brick-making industries, by 1890, large brick buildings replaced the former wooden storefronts. Within a two-year period the population had doubled, reaching 4,699.
Major industries that contributed to the growth of Little Falls were the Pine Tree Lumber Company, Hennepin Paper Company, and two large flour mills. Smaller industries included the Kiewel Brewery, a sash and door factory and a horseshoe factory. Carpenters, cigar manufacturers and blacksmiths were among the numerous tradesmen setting up shop. A major contributor to the economic growth of Little Falls was the surrounding diversified farming. Also evident was a vibrant social and religious community.
When the lumber and flour milling industries declined, others sprang up. Most notable was boat building, which began with the Larson Boat Company, in the 1920's. Boat building was the driving force in Little Falls' industry for nearly 100 years. The City of Little Falls continues to grow with new and innovative, startup companies. Little Falls is home to Hoonuit, an international software company; Lakemaster, a lake mapping software company; AirBorn Inc, a specialty connector company; Wabash National, a leading refrigerated trailer company; Falls Fabricating, a metal fabricating facility; DJ Products, a power trailer moving manufacturer; Mielke Oil, a lubricant and fuel distributor; and Little Falls Machine, a nationally known plow manufacturer. The growth of Little Falls continues, thanks to the early entrepreneurs whose vision gave it impetus.
Little Falls Industrial Park
Population
Population
| Population | 2000 | 2010 | 2025 | 2030 |
|---|---|---|---|---|
| Little Falls | 8,722 | 8,827 | 9,125 | 9,130 |
Source: ESRI, 2025-08-25
Population by Age
| Population | 2025 |
|---|---|
| 0-4 | 505 |
| 5-9 | 552 |
| 10-14 | 527 |
| 15-19 | 560 |
| 20-24 | 460 |
| 25-29 | 486 |
| 30-34 | 509 |
| 35-39 | 607 |
| 40-44 | 532 |
| 45-49 | 477 |
| 50-54 | 445 |
| 55-59 | 524 |
| 60-64 | 634 |
| 65-69 | 557 |
| 70-74 | 527 |
| 75-79 | 469 |
| 80-84 | 314 |
| 85+ | 440 |
| 18+ | 7,184 |
| Median Age | 43 |
Source: ESRI, 2025-08-25
Population by Race
| Little Falls | 2025 |
|---|---|
| Total | 9,125.00 |
| White Alone | 91.86% |
| Black Alone | 1.37% |
| American Indian Alone | 0.58% |
| Asian Alone | 0.64% |
| Pacific Islander Alone | 0.09% |
| Some Other Race | 0.76% |
| Two or More Races | 4.71% |
| Hispanic Origin | 2.47% |
| Diversity Index | 19.40 |
Source: ESRI, 2025-08-25
Growth Rate
| Little Falls | 2025 - 2030 |
|---|---|
| Population | 0.01% |
| Households | 0.14% |
| Families | 0.13% |
| Median Household Income | 1% |
| Per Capita Income | 2% |
Source: ESRI, 2025-08-25
Housing
Households
| Population | 2000 | 2010 | 2025 | 2030 |
|---|---|---|---|---|
| Households | 3,555 | 3,795 | 4,028 | 4,056 |
| Housing Units | 3,721 | 4,061 | 4,273 | 4,291 |
| Owner Occupied Units | 2,460 | 2,542 | ||
| Renter Occupied Units | 1,568 | 1,514 | ||
| Vacant Units | 245 | 235 |
Source: ESRI, 2025-08-25
Home Value
| Little Falls | 2025 | 2030 |
|---|---|---|
| Median Home Value | $225,326 | $233,619 |
| Average Home Value | $241,790 | $251,736 |
| <$50,000 | 54 | 47 |
| $50,000 - $99,999 | 148 | 144 |
| $100,000 - $149,999 | 283 | 270 |
| $150,000 - $199,999 | 473 | 457 |
| $200,000 - $249,999 | 537 | 525 |
| $250,000 - $299,999 | 456 | 501 |
| $300,000 - $399,999 | 270 | 307 |
| $400,000 - $499,999 | 176 | 211 |
| $500,000 - $749,999 | 53 | 67 |
| $1,000,000 + | 5 | 6 |
Source: ESRI, 2025-08-25
Housing Year Built
| Year Range | Houses Built |
|---|---|
| 2010 or Later | 211 |
| 2000-2009 | 477 |
| 1990-1999 | 398 |
| 1980-1989 | 404 |
| 1970-1979 | 620 |
| 1960-1969 | 169 |
| 1950-1959 | 728 |
| 1940-1949 | 307 |
| 1939 or Before | 934 |
Source: ESRI, 2025-08-25
Back To TopIncome
Income
| Little Falls | 2025 | 2030 |
|---|---|---|
| Median Household | $53,945 | $57,332 |
| Average Household | $75,630 | $81,389 |
| Per Capita | $33,447 | $36,219 |
Source: ESRI, 2025-08-25
Household Income
| Little Falls | 2025 |
|---|---|
| <$15,000 | 445 |
| $15,000 - $24,999 | 428 |
| $25,000 - $34,999 | 349 |
| $35,000 - $49,999 | 635 |
| $50,000 - $74,999 | 712 |
| $75,000 - $99,999 | 502 |
| $100,000 - $149,999 | 478 |
| $150,000 - $199,999 | 312 |
| $200,000+ | 167 |
Source: ESRI, 2025-08-25
Back To TopEmployees
Commute
| Category | Commuters |
|---|---|
| Workers 16+ | 3,811 |
| In-County Residents | 2,764 |
| Out-of-County Residents | 1,040 |
| Drive Alone | 2,971 |
| Carpooled | 405 |
| Public Transport | 40 |
| Work at Home | 214 |
| Motorcycle | 10 |
| Bicycle | 0 |
| Walked | 103 |
| Other | 68 |
| Less than 5 minutes | 400 |
| 5-9 minutes | 979 |
| 10-14 minutes | 558 |
| 15-19 minutes | 195 |
| 20-24 minutes | 213 |
| 25-29 minutes | 115 |
| 30-34 minutes | 366 |
| 35-39 minutes | 147 |
| 40-44 minutes | 161 |
| 45-59 minutes | 299 |
| 60-89 minutes | 132 |
| 90+ minutes | 32 |
| Average Travel Time | 0 |
Source: ESRI, 2025-08-25
Source: ESRI, 2025-08-25
Employees by NAICS
| Category | Number |
|---|---|
| Total Employees | 6,768 |
| Agr/Forestry/Fish/Hunt | 32 |
| Mining | 0 |
| Utilities | 10 |
| Construction | 245 |
| Manufacturing | 551 |
| Wholesale Trade | 132 |
| Retail Trade | 1,074 |
| Motor Veh/Parts Dealers | 71 |
| Furn & Home Furnish Str | 13 |
| Electronics & Appl Store | 6 |
| Bldg Matl/Garden Equip | 73 |
| Food & Beverage Stores | 353 |
| Health/Pers Care Stores | 69 |
| Gasoline Stations | 18 |
| Clothing/Accessory Store | 22 |
| Sports/Hobby/Book/Music | 49 |
| General Merchandise Str | 400 |
| Transportation/Warehouse | 102 |
| Information | 112 |
| Finance & Insurance | 157 |
| Cntrl Bank/Crdt Intrmdtn | 49 |
| Sec/Cmdty Cntrct/Oth Inv | 35 |
| Insur/Funds/Trusts/Other | 73 |
| Real Estate/Rent/Leasing | 87 |
| Prof/Scientific/Tech Srv | 156 |
| Legal Services | 11 |
| Mgmt of Comp/Enterprises | 5 |
| Admin/Support/Waste Mgmt | 78 |
| Educational Services | 695 |
| HealthCare/Social Assist | 1,118 |
| Arts/Entertainment/Rec | 158 |
| Accommodation/Food Srvcs | 544 |
| Accommodation | 66 |
| Food Srv/Drinking Places | 478 |
| Other Srv excl Pub Admin | 616 |
| Auto Repair/Maintenance | 27 |
| Public Administration Emp | 885 |
Source: ESRI, 2025-08-25
Educational Attainment (25+)
| Little Falls | 2025 |
|---|---|
| <9th Grade | 215 |
| Some High School | 273 |
| GED | 237 |
| Graduated High School | 2,206 |
| Some College/No Degree | 1,358 |
| Associates Degree | 730 |
| Bachelor's Degree | 944 |
| Graduate Degree | 558 |
Source: ESRI, 2025-08-25
Back To TopBusinesses
Businesses by NAICS
| Category | Number |
|---|---|
| Total Businesses | 593 |
| Agr/Forestry/Fish/Hunt Bus | 2 |
| Mining Bus | 0 |
| Utilities Bus | 2 |
| Construction Bus | 35 |
| Manufacturing Bus | 23 |
| Wholesale Trade Bus | 14 |
| Retail Trade Bus | 78 |
| Motor Veh/Parts Dealers Bus | 9 |
| Furn & Home Furnish Str Bus | 4 |
| Electronics & Appl Store Bus | 3 |
| Bldg Matl/Garden Equip Bus | 11 |
| Food & Beverage Stores Bus | 18 |
| Health/Pers Care Stores Bus | 10 |
| Gasoline Stations Bus | 5 |
| Clothing/Accessory Store Bus | 4 |
| Sports/Hobby/Book/Music Bus | 9 |
| General Merchandise Str Bus | 5 |
| Transportation/Warehouse Bus | 11 |
| Information Bus | 13 |
| Finance & Insurance Bus | 35 |
| Cntrl Bank/Crdt Intrmdtn Bus | 6 |
| Sec/Cmdty Cntrct/Oth Inv Bus | 10 |
| Insur/Funds/Trusts/Other Bus | 19 |
| Real Estate/Rent/Leasing Bus | 23 |
| Prof/Scientific/Tech Srv Bus | 29 |
| Legal Services Bus | 2 |
| Mgmt of Comp/Enterprises Bus | 1 |
| Admin/Support/Waste Mgmt Bus | 23 |
| Educational Services Bus | 18 |
| HealthCare/Social Assist Bus | 78 |
| Arts/Entertainment/Rec Bus | 19 |
| Accommodation/Food Srvcs Bus | 37 |
| Accommodation Bus | 7 |
| Food Srv/Drinking Places Bus | 30 |
| Other Srv excl Pub Admin Bus | 81 |
| Auto Repair/Maintenance Bus | 11 |
| Public Administration Bus | 40 |
Source: ESRI, 2025-08-25
Back To Top